Interactive Financial Data Dashboard - Python & Streamlit
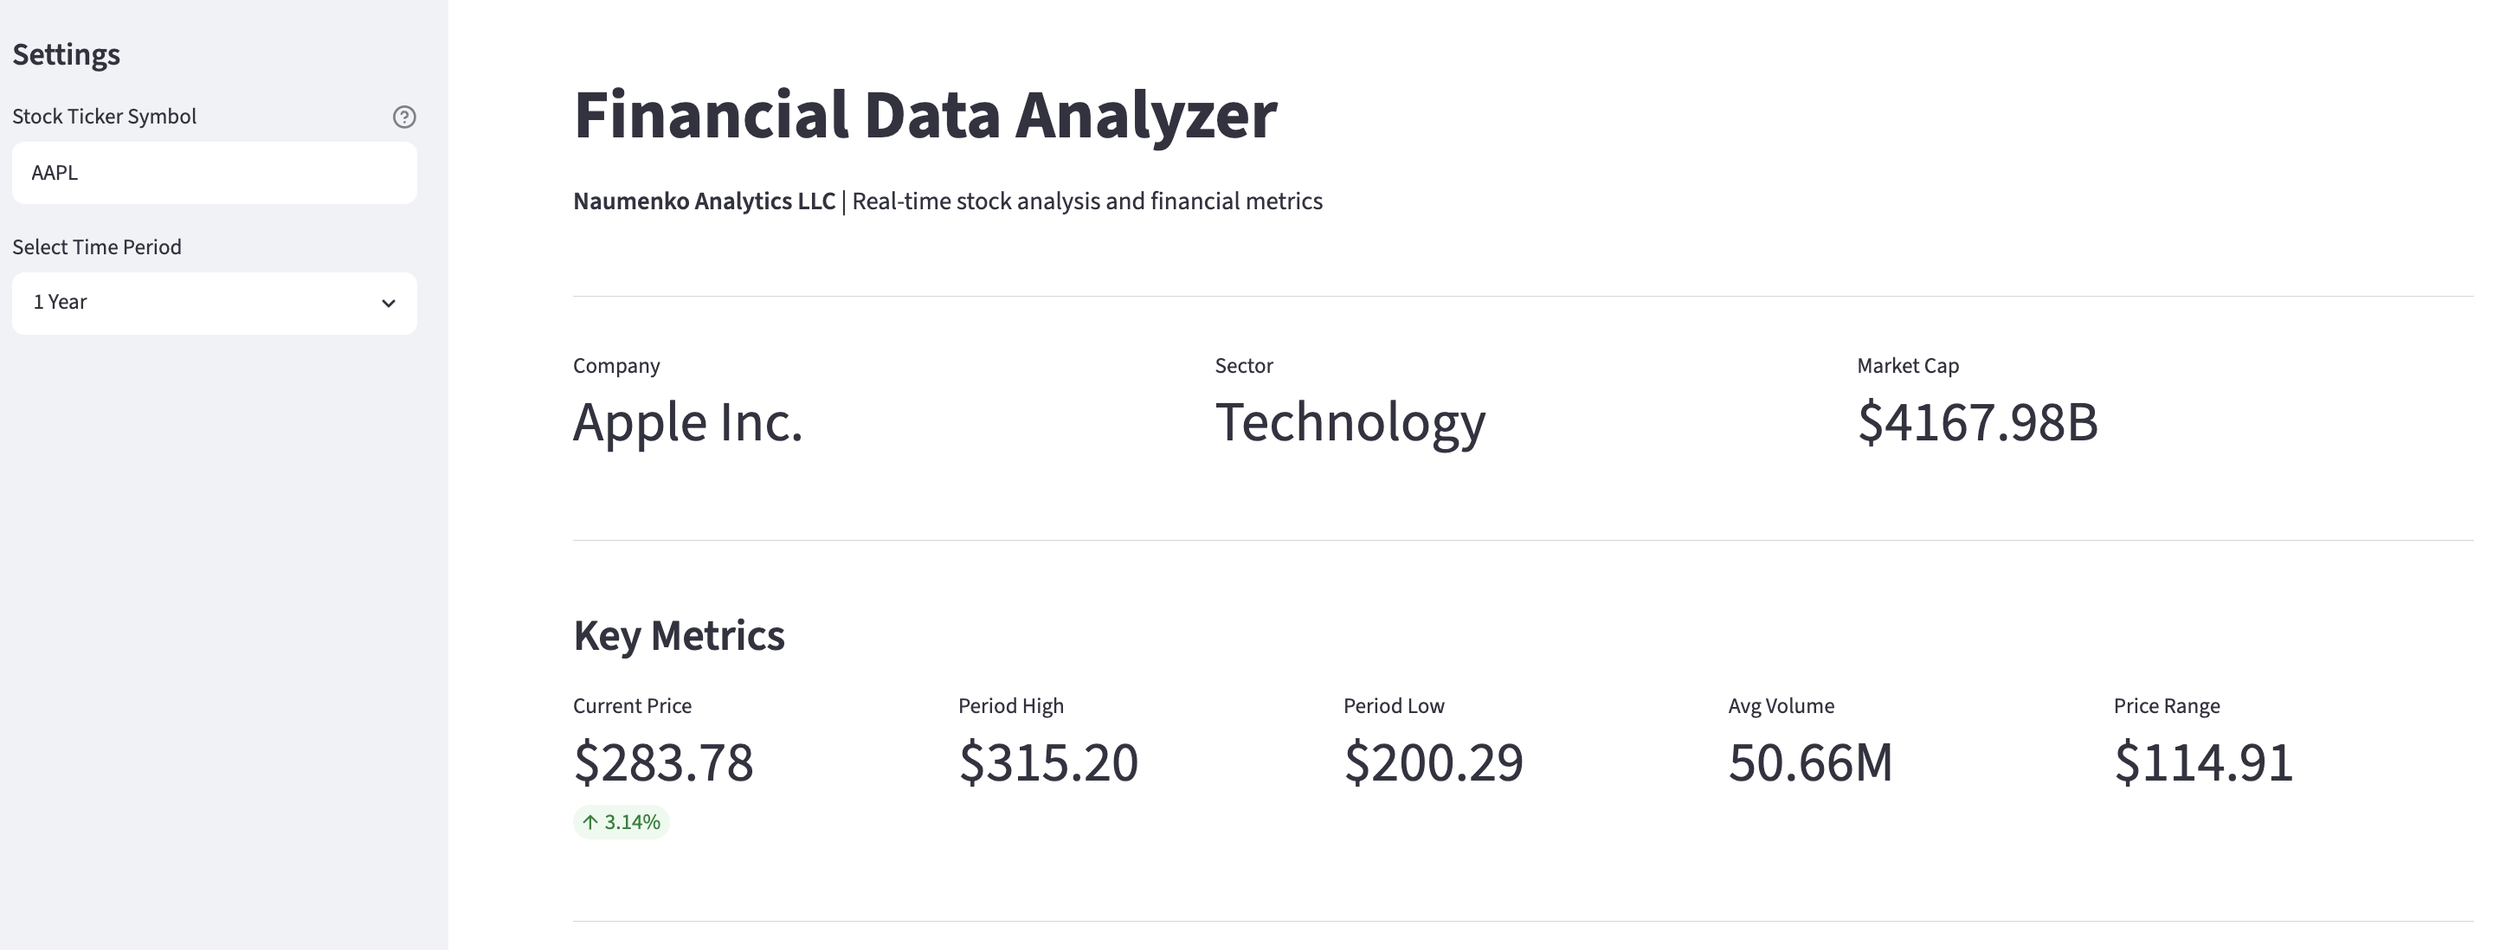
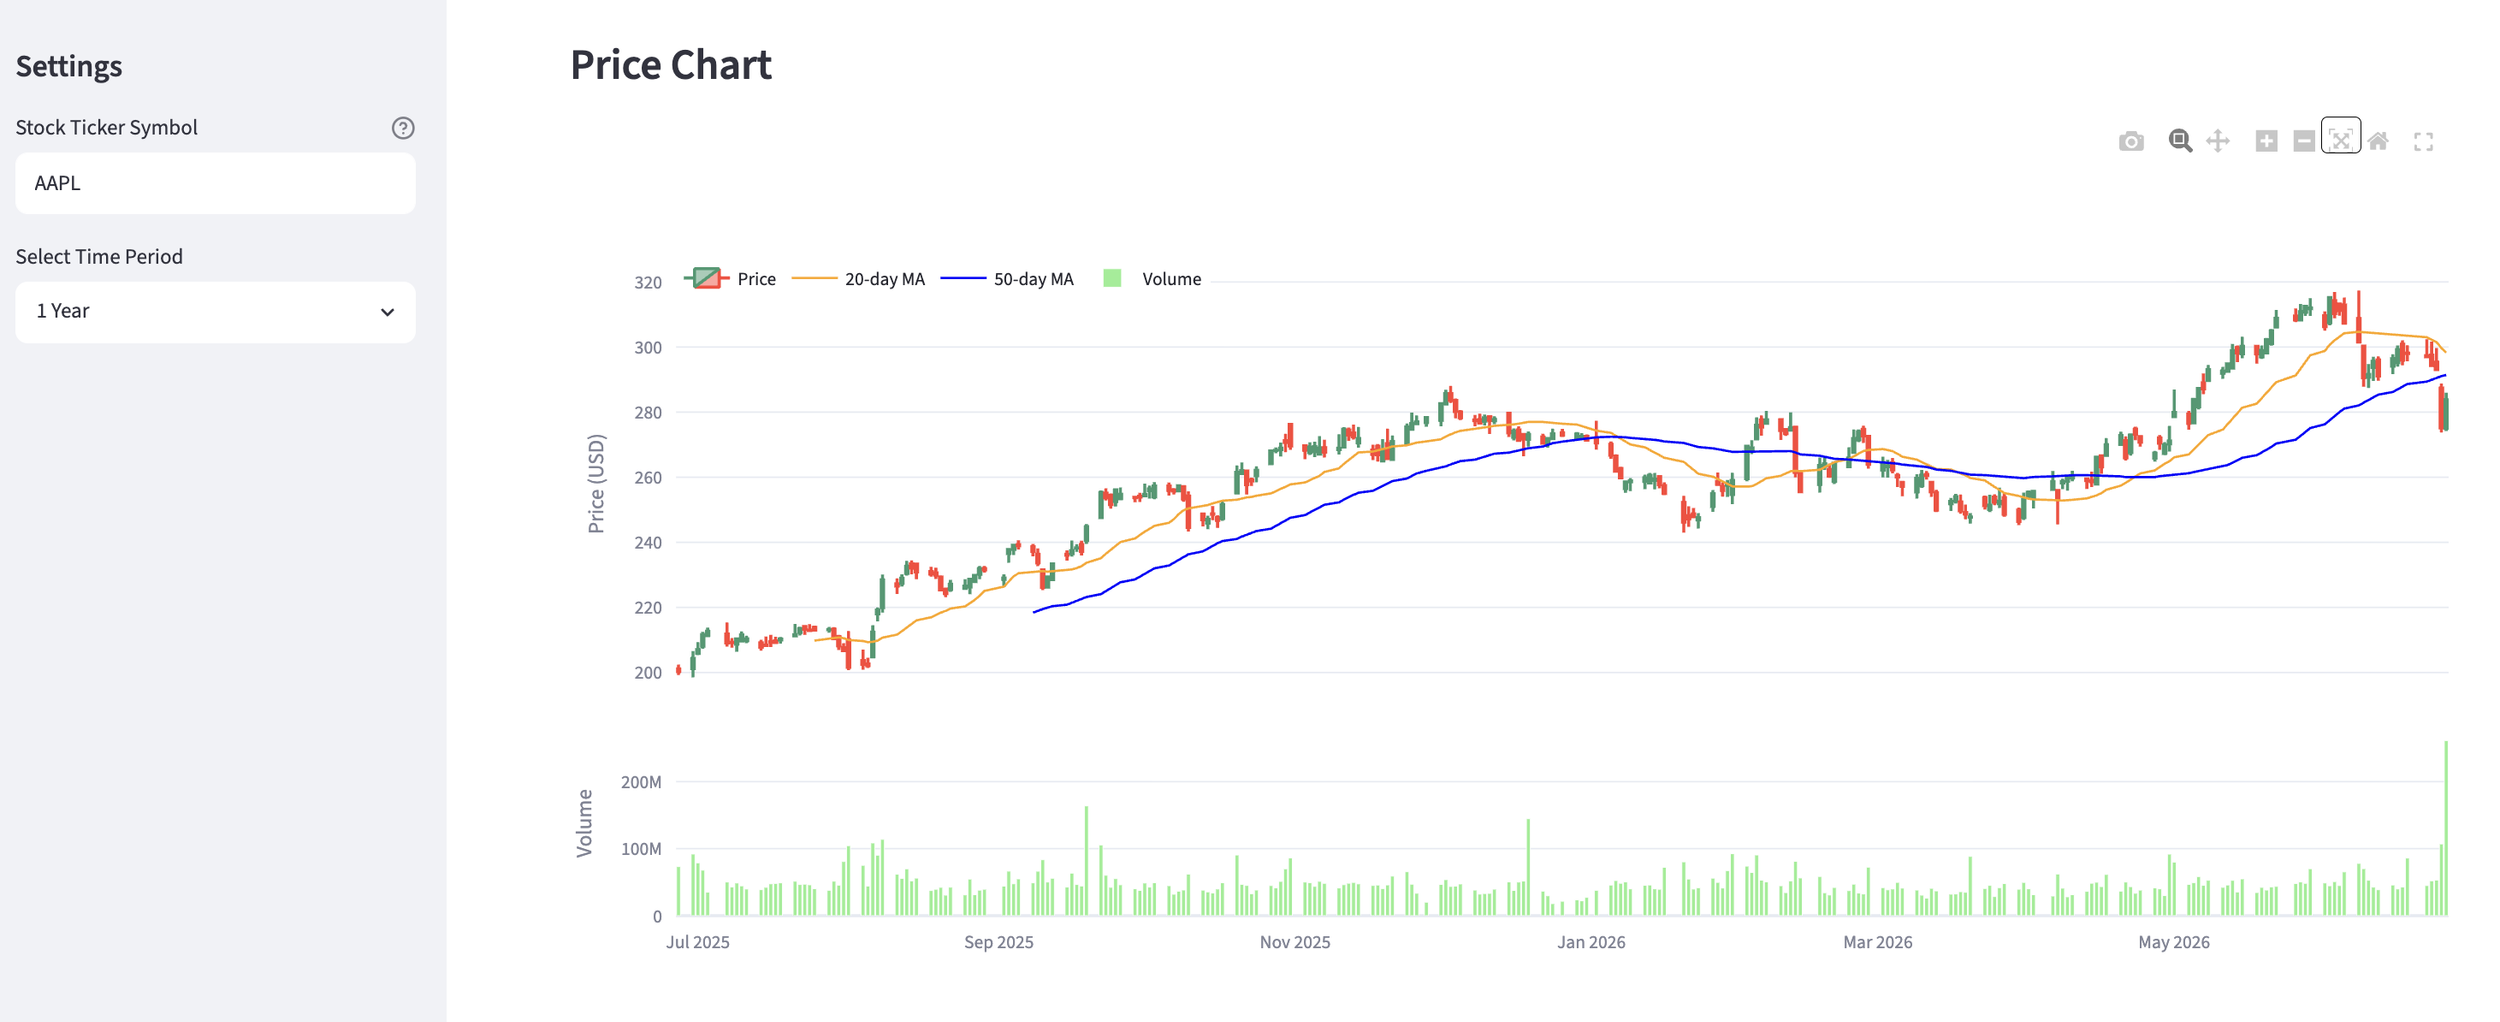
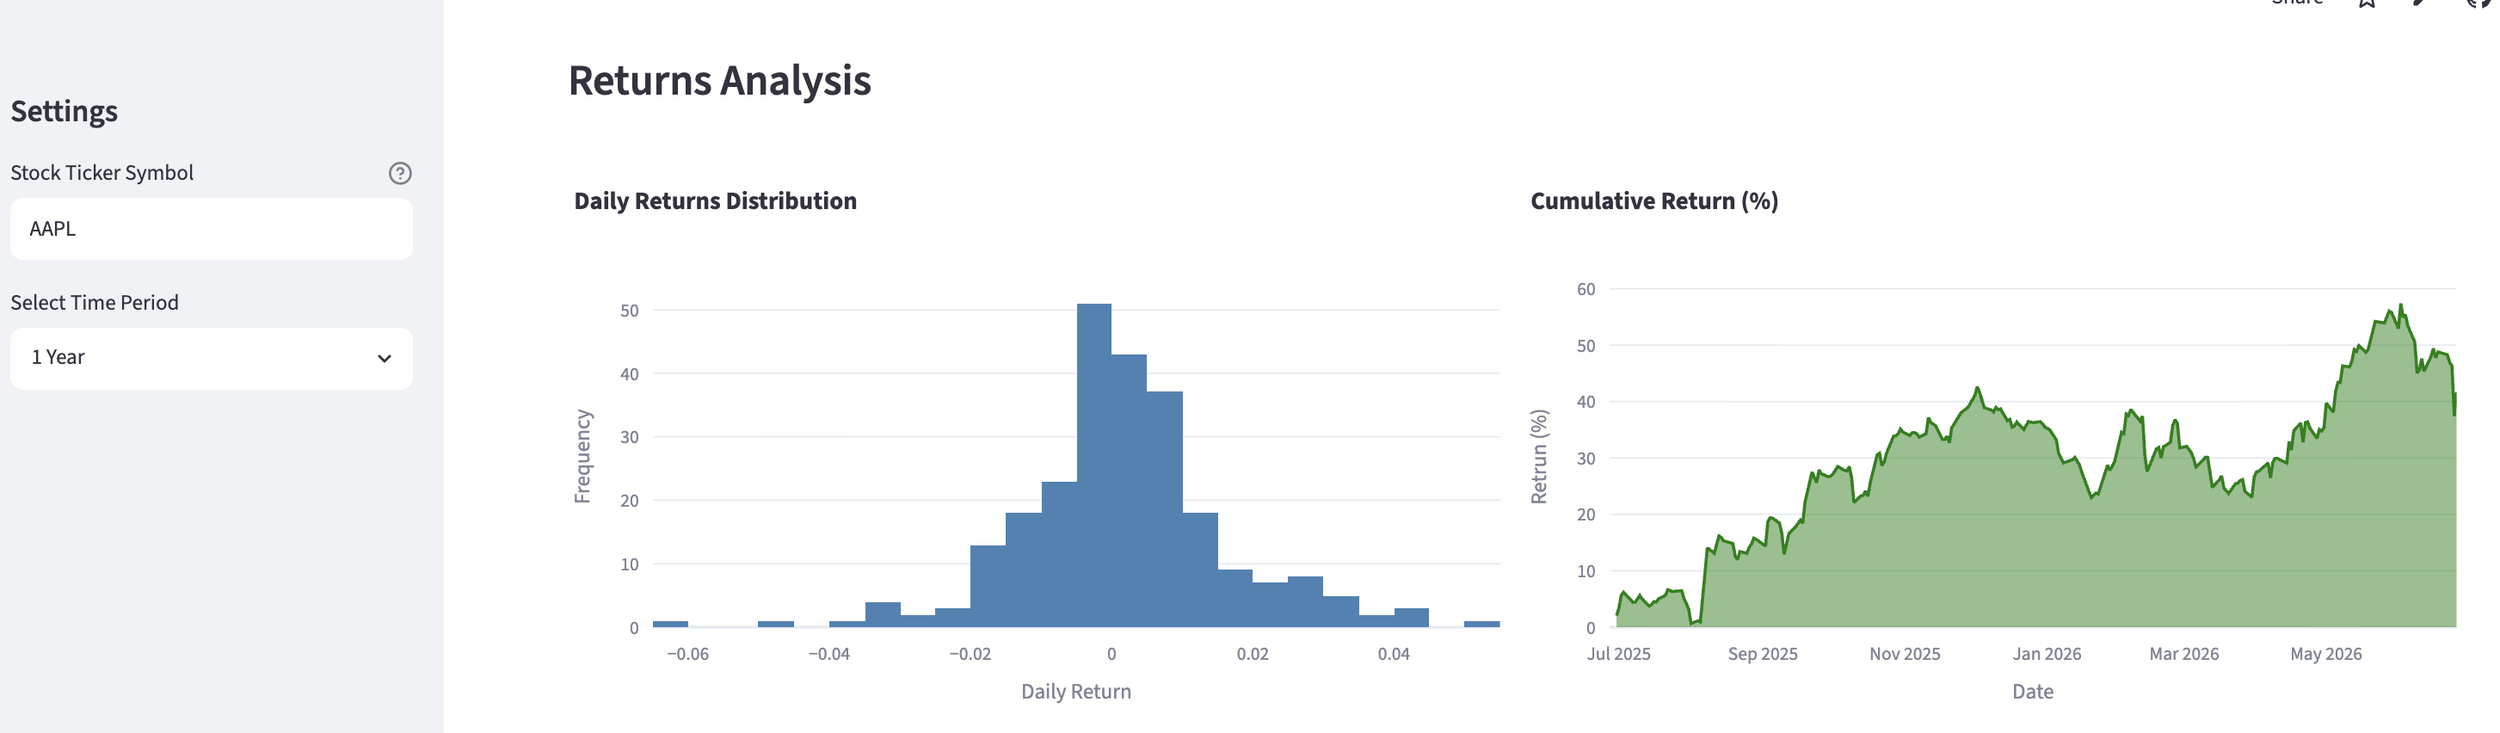
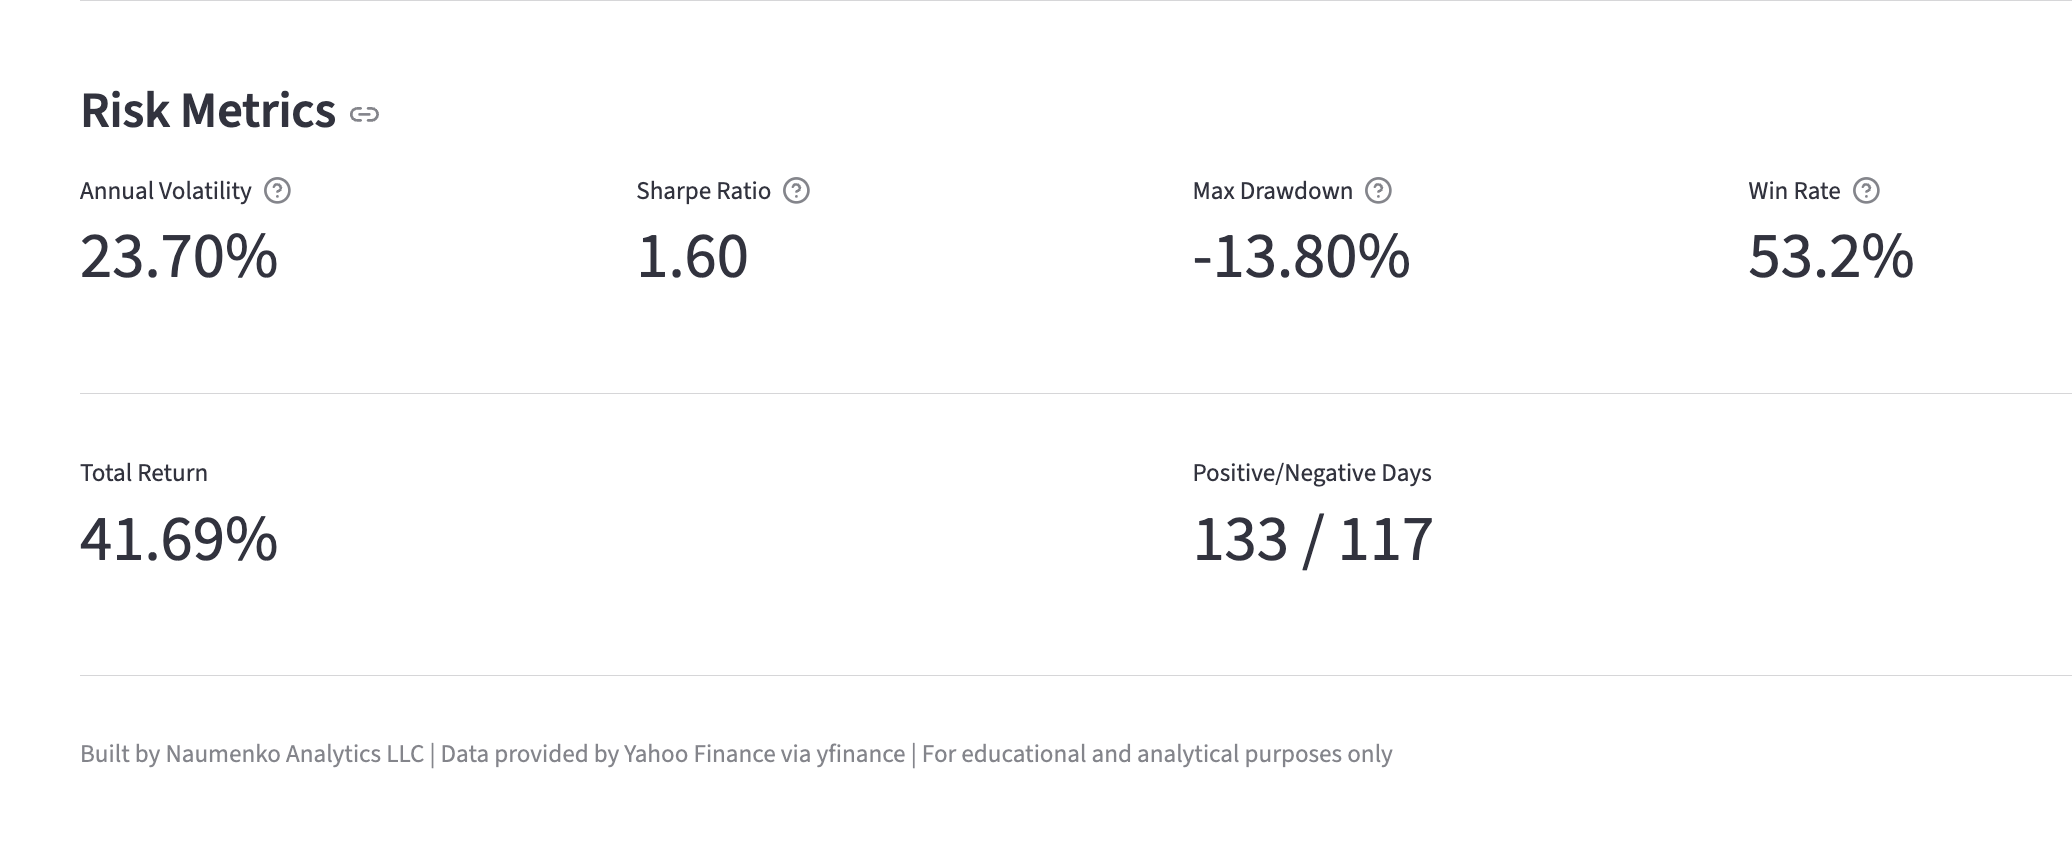
A live, interactive dashboard for analyzing any stock's performance and risk profile. Users enter a ticker and time period, and the app pulls market data to display key metrics, an interactive candlestick price chart with moving averages, returns analysis, and a full risk panel: Sharpe ratio, annual volatility, max drawdown, and win rate.
Built as a clean, self-serve tool that turns raw market data into a clear visual picture, with dropdown-driven controls so users can explore different stocks and timeframes without touching code.
Built with: Python, Streamlit, pandas
Demonstrates end-to-end dashboard development: data ingestion, financial metric calculation, interactive visualization, and deployment.
Live demo: https://naumenko-analytics-stock-analyzer.streamlit.app/